
| Gold/Karat –Silver | Buy | Sell |
|---|---|---|
| International ounce/USD | 3,995.00 | 3,994.60 |
| International 24/USD per gram | 128.36 | 128.44 |
| Local Market 24/ gram | 7,191.85 | 7,130.72 |
| Local Market 21/ gram | 6,293.50 | 6,240.00 |
| Local Market 18/ gram | 5,394.43 | 5,348.57 |
| Local Market Silver/ gram | 96.70 | 93.34 |
Gold prices hold steady on October 21
Updated 10/21/2026 3:45:00 PMGold prices slightly up on October 19
Updated 10/19/2026 3:57:00 PMGold prices hold steady on October 18
Updated 10/18/2026 3:43:00 PMGold prices surge on October 15
Updated 10/15/2026 3:23:00 PMGold prices slightly down on October 14
Updated 10/14/2026 3:50:00 PMUSD exceeds EGP 55 mark at local banks on October 22
Updated 10/22/2026 3:06:00 PMUSD/EGP exchange rates slightly down on October 21
Updated 10/21/2026 2:44:00 PMUS dollar exceeds EGP 54 mark at local banks
Updated 10/20/2026 2:31:00 PMUSD nears EGP 54 on October 19 at Egyptian banks
Updated 10/19/2026 1:44:00 PMUS dollar trades above EGP 53.5 at local banks
Updated 10/18/2026 2:38:00 PM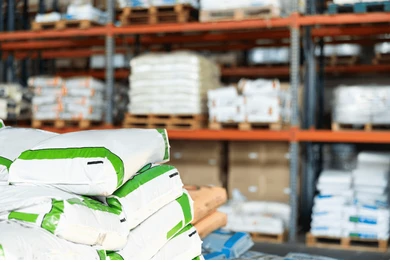
| Item | Price | Daily | Monthly | Yearly |
|---|---|---|---|---|
| Ammonium sulphate 20.6% / Ton | 18,973.30 | -6 % | 1.1 % | 6 % |
| Ammonium nitrate 33.5% / Ton | 23,327.80 | -0.2 % | -2.5 % | 2.7 % |
| Urea 46.5% / Ton | 23,777.80 | -0.4 % | -3.4 % | -2.1 % |
| Grey cement / Ton | 4,109.10 | 1.6 % | -0.5 % | -0.1 % |
| Iron ore / Ton | 38,234.10 | -0.6 % | 0.9 % | 2.1 % |
| Ezz Steel / Ton | 40,357.70 | 0.7 % | 2.3 % | 1.9 % |
|
Source : Information & Decision Support Center
|
Last Updated : 2026-10-23
|
|||
IDSC announces prices of fertilizers, building materials on October 22
Updated 10/22/2026 2:05:00 PMFertilizers, building materials prices mixed on October 20
Updated 10/20/2026 2:01:00 PMFertilizers, building materials prices mixed on October 14
Updated 10/14/2026 12:47:00 PMIDSC unveils prices of fertilizers, building materials on October 13
Updated 10/13/2026 12:09:00 PMFertilizers, building materials jump on October 12
Updated 10/12/2026 11:40:00 AM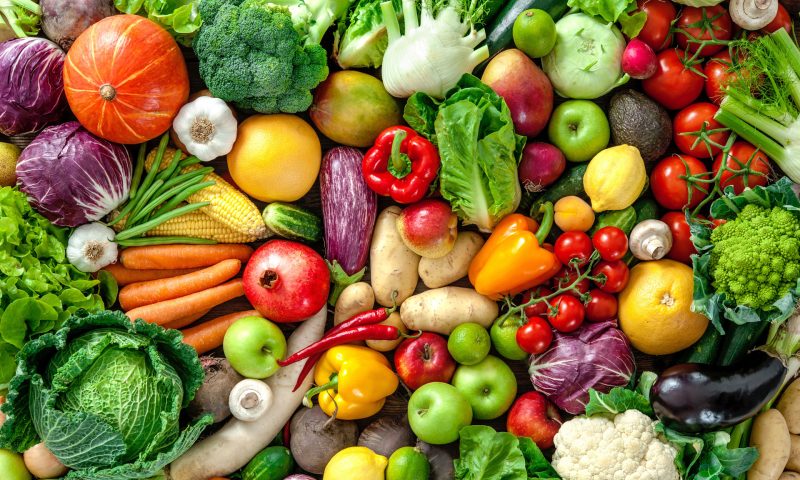
| Item | Price | Daily | Monthly | Yearly |
|---|---|---|---|---|
| Packed Rice / Kg | 33.7 | -2.8 % | -2.5 % | -2.4 % |
| Sunflower oil /Kg | 28.8 | 3.8 % | 10.7 % | 10.2 % |
| Packed Sugar / Kg | 34.7 | 1.2 % | 3.8 % | -2.6 % |
| Packed Fava Beans / Kg | 66.4 | 5.5 % | 8.5 % | 11.1 % |
| Packed Pasta / Kg | 33.8 | 1.4 % | 6 % | 6.3 % |
| Packed Flour / Kg | 105.7 | 1 % | 5.3 % | 13.1 % |
| Tomato / Kg | 21.7 | -5.6 % | -12.8 % | 16 % |
| Onion / Kg | 20.3 | 8.4 % | 20.9 % | 35.9 % |
| Cucumber / Kg | 21.8 | -4.6 % | 0.2 % | 7.8 % |
| Lemon / Kg | 38.2 | 3.2 % | -1.5 % | 18.1 % |
|
Source : Information & Decision Support Center
|
Last Updated : 2026-10-23
|
|||
Food commodities, vegetables mixed on October 22
Updated 10/22/2026 2:38:00 PMPrices of basic commodities, vegetables announced on October 20
Updated 10/20/2026 3:00:00 PMFood commodities, vegetables mixed on October 13
Updated 10/13/2026 12:42:00 PMBasic commodities, vegetables down on October 11
Updated 10/11/2026 11:44:00 AMIDSC unveils prices of food commodities, vegetables on October 7
Updated 10/7/2026 3:27:00 PM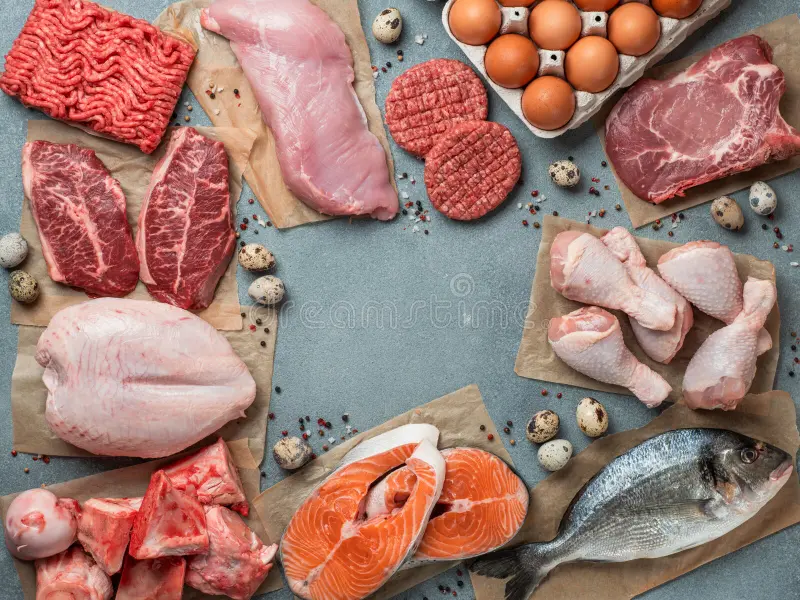
| Item | Price | Daily | Monthly | Yearly |
|---|---|---|---|---|
| Fresh Poultry / Kg | 87.3 | -1.3 % | 9.1 % | 14.7 % |
| Fresh Meat / Kg | 457.8 | 2.5 % | 5 % | 11.6 % |
| Fish / Kg | 86.1 | -3.6 % | -2.3 % | -3.7 % |
| Milk / Litre | 46.1 | -0.7 % | 4.5 % | 4.3 % |
| White Eggs carton | 112.1 | -0.9 % | 3.6 % | -26.2 % |
|
Source : Information & Decision Support Center
|
Last Updated : 2026-10-23
|
|||
Prices of meat, fish, dairy products mixed on October 22
Updated 10/22/2026 1:42:00 PMIDSC unveils prices of meat, poultry, fish on October 20
Updated 10/20/2026 2:32:00 PMIDSC records rise in prices on poultry, meat, fish on October 14
Updated 10/14/2026 11:58:00 AMMeat, poultry, fish prices unveiled on October 13
Updated 10/13/2026 12:00:00 PMPoultry, meat, fish prices mixed on October 12
Updated 10/12/2026 12:20:00 PM
| Index | Value | Day | Week | Month | 3 Months | 6 Months | Year | YTD |
|---|---|---|---|---|---|---|---|---|
| EGX100 EWI | 0.00 | 23,881.72 (0 %) | 24,607.43 (0 %) | 0.00 (0 %) | 0.00 (0 %) | 0.00 (0 %) | 15,720.93 (0 %) | 17,425.88 (0 %) |
| EGX30 | 0.00 | 52,854.95 (0 %) | 52,273.34 (0 %) | 0.00 (0 %) | 0.00 (0 %) | 0.00 (0 %) | 37,576.55 (0 %) | 41,828.97 (0 %) |
| EGX30 Capped | 0.00 | 65,679.53 (0 %) | 65,238.45 (0 %) | 0.00 (0 %) | 0.00 (0 %) | 0.00 (0 %) | 46,100.58 (0 %) | 51,568.39 (0 %) |
| EGX30 TR | 0.00 | 24,663.37 (0 %) | 24,391.97 (0 %) | 0.00 (0 %) | 0.00 (0 %) | 0.00 (0 %) | 16,978.99 (0 %) | 19,022.17 (0 %) |
| EGX35-LV | 0.00 | 6,105.42 (0 %) | 6,246.22 (0 %) | 0.00 (0 %) | 0.00 (0 %) | 0.00 (0 %) | 4,284.26 (0 %) | 4,658.13 (0 %) |
| EGX70 EWI | 0.00 | 17,732.58 (0 %) | 18,481.55 (0 %) | 0.00 (0 %) | 0.00 (0 %) | 0.00 (0 %) | 11,997.41 (0 %) | 13,125.33 (0 %) |
| SHARIAH | 0.00 | 6,329.79 (0 %) | 6,378.90 (0 %) | 0.00 (0 %) | 0.00 (0 %) | 0.00 (0 %) | 3,829.30 (0 %) | 4,597.77 (0 %) |
| TAMAYUZ | 0.00 | 39,177.96 (0 %) | 41,231.41 (0 %) | 0.00 (0 %) | 0.00 (0 %) | 0.00 (0 %) | 15,901.50 (0 %) | 21,087.55 (0 %) |
EGX closes Thursday’s trading session down
Updated 10/22/2026 3:30:00 PMEGX indices close Wednesday mixed
Updated 10/21/2026 3:17:00 PMEGX closes Tuesday with collective gains; market cap totals EGP 4T
Updated 10/20/2026 3:17:00 PMEGX ends Monday’s trading session on varied note
Updated 10/19/2026 3:43:00 PMEGX finishes Sunday’s trading session in red zone
Updated 10/18/2026 3:20:00 PM
| Country | Index | Value | Change | Change % | Low | High | Open |
|---|
EGX shows varied performance on Tuesday
Updated 8/25/2026 2:40:00 PMEGX ends Monday’s session on varied note
Updated 7/13/2026 2:52:00 PMDFM, ADX retreat at Monday’s close
Updated 5/18/2026 2:43:00 PMBahrain Bourse closes Monday lower
Updated 5/18/2026 2:29:00 PMBoursa Kuwait posts varied performance at Monday close
Updated 5/18/2026 2:23:00 PM
